A well-thought-out design is essential for a clean and structured documentation as well as a transparent comparison of the results and the performance of individual tools. Equally important is the use of qualified personnel, which usually has only a small time frame for the test since the test access is provided for a few days.
The CURE TOOLTEST takes place in a period of seven days and is divided in four test areas:
Setup
Performance & data volume
Editing & tagging of the results
Export, dashboard, reporting & alerting
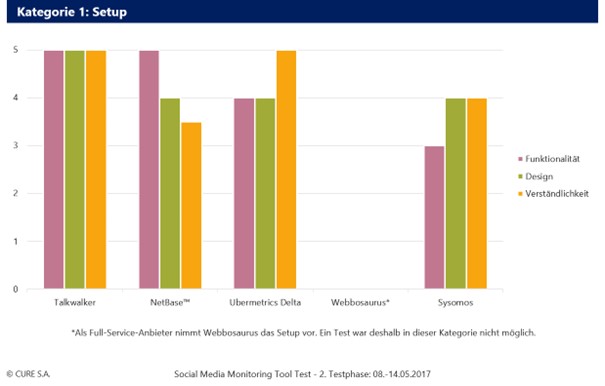
SETUP
Setup includes the creation of new monitoring projects, such as social media channels or campaigns, the design of search strings (so-called queries), the creation of users and the assignment of rights. Here, up to five points can be assigned in the categories usability, functionality, design and intelligibility.
PERFORMANCE & DATA VOLUME
At performance & data, server capacity as well as the source cover are in the foreground. Quality and quantity, relevance, diversity of “source types”, search speed and language and sentiment recognition are evaluated. The results of different tools are collected and compared to the same search string (query) during the testing period.
EDITING & TAGGING OF RESULTS
At CURE, we attach great importance to a convenient and intuitive handling of the tools for a fast mass processing, as we have many projects and results every day.
Editing-bookmarks for fast access on personalised filters
Fast-tagging-shortcuts to prioritise, classify or delete results
Automated tagging, which provides results on defined keywords with specific terms
Again, up to five points can be assigned in the categories usability, functionality, design and intelligibility.
EXPORT, DASHBOARD, REPORTING & ALERTING
In this area, all possibilities of data visualisation are tested. When exporting, the maximum number of records per file (CSV, XLS, DOC, PPT, etc.) as well as the exportable metrics such as range, follower or fan number on Twitter and Facebook, number of comments on news, retweets of tweets or share of Facebook posts is crucial for better data quality. With Dashboard, reporting and alerting, it is also about the possibilities of exporting or sending but also about the design of the individual points: It is considered how easy and fast a dashboard can be created, the quality of the diagrams, the format in which a report can be sent (HTML, PPT, PDF etc.), how good the alerts are and how well they can be adjusted. The categories usability, functionality, design, quality of the export file are evaluated with up to five points.