Python – “This is the new hit in IT.” Those were the words of my computer science teacher 8 years ago by now. He was to be proven right with his statement. In this post, we’ll explain why Python is useful for your data-driven marketing and the various benefits of using Python.
What is Python exactly?
Python is an easy-to-learn programming language with an extensive standard library that can be extended for numerous application areas, including in the Big Data context. Modules such as Pandas, SQLAlchemy and pyodbc will continue to be provided with new features in the future to facilitate a wide variety of implementation paths for developers. These are briefly explained here:
Pandas is a software library written for Python. It is used for data manipulation and analysis and also plays a central role in the project mentioned later. Pandas provides special functions and data structures for manipulating numerical table and time series. For Pandas, NumPy, a scientific computing module, is a prerequisite for installation and use.
SQLAlchemy and pyodbc are modules that allow Python and SQL to communicate directly. For example, they can be used to send queries directly from Python to an SQL database and immediately load the results back into the Python script. Furthermore, existing Excel files can be transferred to an SQL database in seconds without going through the script. Instead, the terminal is directly controlled by SQL.
Great potential for your social media report with Python
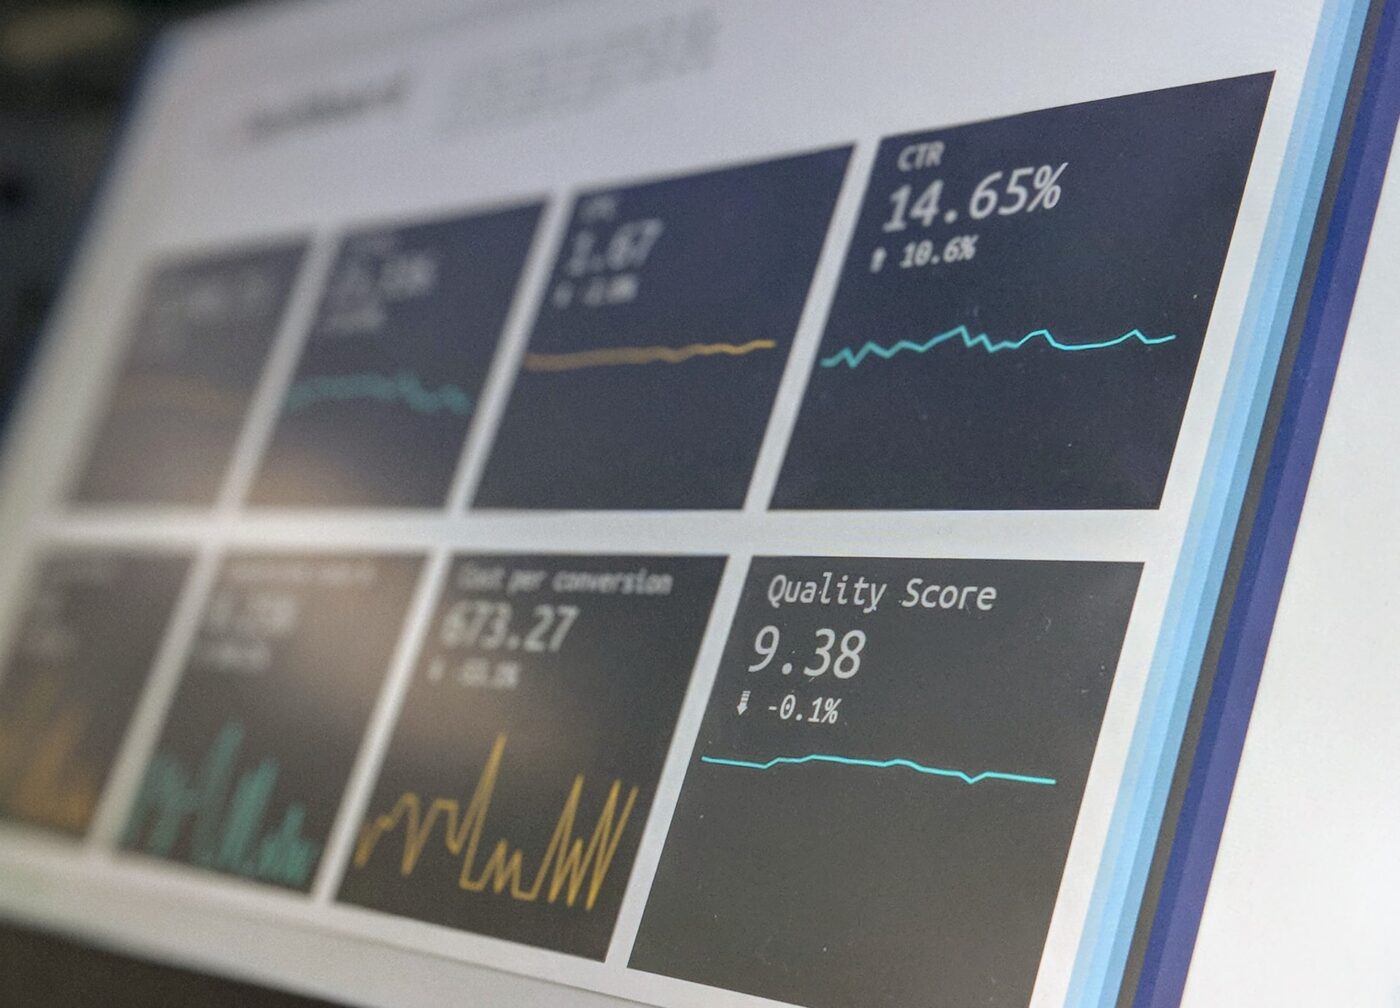
So what is the exact potential of all these functions? With the help of these functions, monthly reports can be created on social media activities, among other things. At the beginning of each month, such a report is fed with new data. This involves exporting data sets from various external sources such as YouTube, Facebook, Instagram and Twitter for a given search term. These data sets are usually in the form of large Excel tables and often contain several hundred thousand rows.
For social media reporting, current key performance indicators (KPIs) must be calculated from this data and then visualized in the report. Unfortunately, the standard Excel format does not provide an optimal basis for this. The KPIs have to be calculated using Excel-internal macros, which are very slow and unstable with large tables. This is because the software is simply not optimized for this purpose. It can sometimes take hours to calculate the new KPIs after occasional crashes of Excel. And this is where Python comes in.
Python and the vision of CURE Intelligence
For several customer projects, CURE has developed an elaborate script using Python that reads in all exports from external data sources, performs all calculations itself, and then stores the results along with the KPIs in an SQL datatable. The reports are automatically fed with the new performance values – all with a single mouse click. Of course, this is also interesting from a business perspective. Employees who used to spend many hours manually creating such reports now have more time resources, e.g. for qualitative evaluations. In addition, any potential for errors and long loading times is minimized, since all calculations are outsourced to Python. SQL databases are suitable for exactly this purpose, reading large amounts of data quickly and filtering them according to specific values. Therefore, SQL allows an immensely faster database structure compared to Excel.
Pandas – Python’s miracle machine?
Once a table has been read in by Pandas, it appears as a table or so-called dataframe in the programming environment. This module can both load and edit various file formats such as CSV, Excel files, JSON, SQL and more. Pandas is derived from the term “Panel Data” – a term for structured, multidimensional data. Pandas defines special objects to manage, edit, manipulate and analyze the data. A so-called “Series” is generally a data structure with one row and any number of columns. It is suitable for viewing the progression of a changing variable (Ex: The subscriber count of your social media account) over a given period of time. “Dataframes” are two-dimensional data structures whose rows and columns resemble a simple table. A data panel consists of data sets in three dimensions – i.e. a table whose entries are lists.
Pandas provides a variety of free tools and functionalities for editing the data, including:
Data indexing
Compatibility with some file formats
Data customization and cleansing tools
Decomposition of large data structures
Manipulation of data (such as deleting or adding columns)
Aggregation, transformation and merging of data
Adjustment of time series
Filtering of data based on freely selectable criteria
Conclusion: Automation saves time and money
Pandas, the program library for the Python programming language, is widely used in many fields. Typically, financial analysis, statistics, web analytics, marketing analytics, Big Data and business intelligence require the management, manipulation and evaluation of tabular data or time series. With the expertise at CURE, we can also help you get a better overview of your social media presence. If you have any questions or concerns, please feel free to contact us directly.